SQUAB
A Fast Benchmarking Software
for Surface Quantum Computing Architectures
Three different ways to display a tiling are offered.
The figure of the tiling will be generated in the main folder
in the file figure.pdf. The file figure.tex contains the latex
source file used to generate the figure.
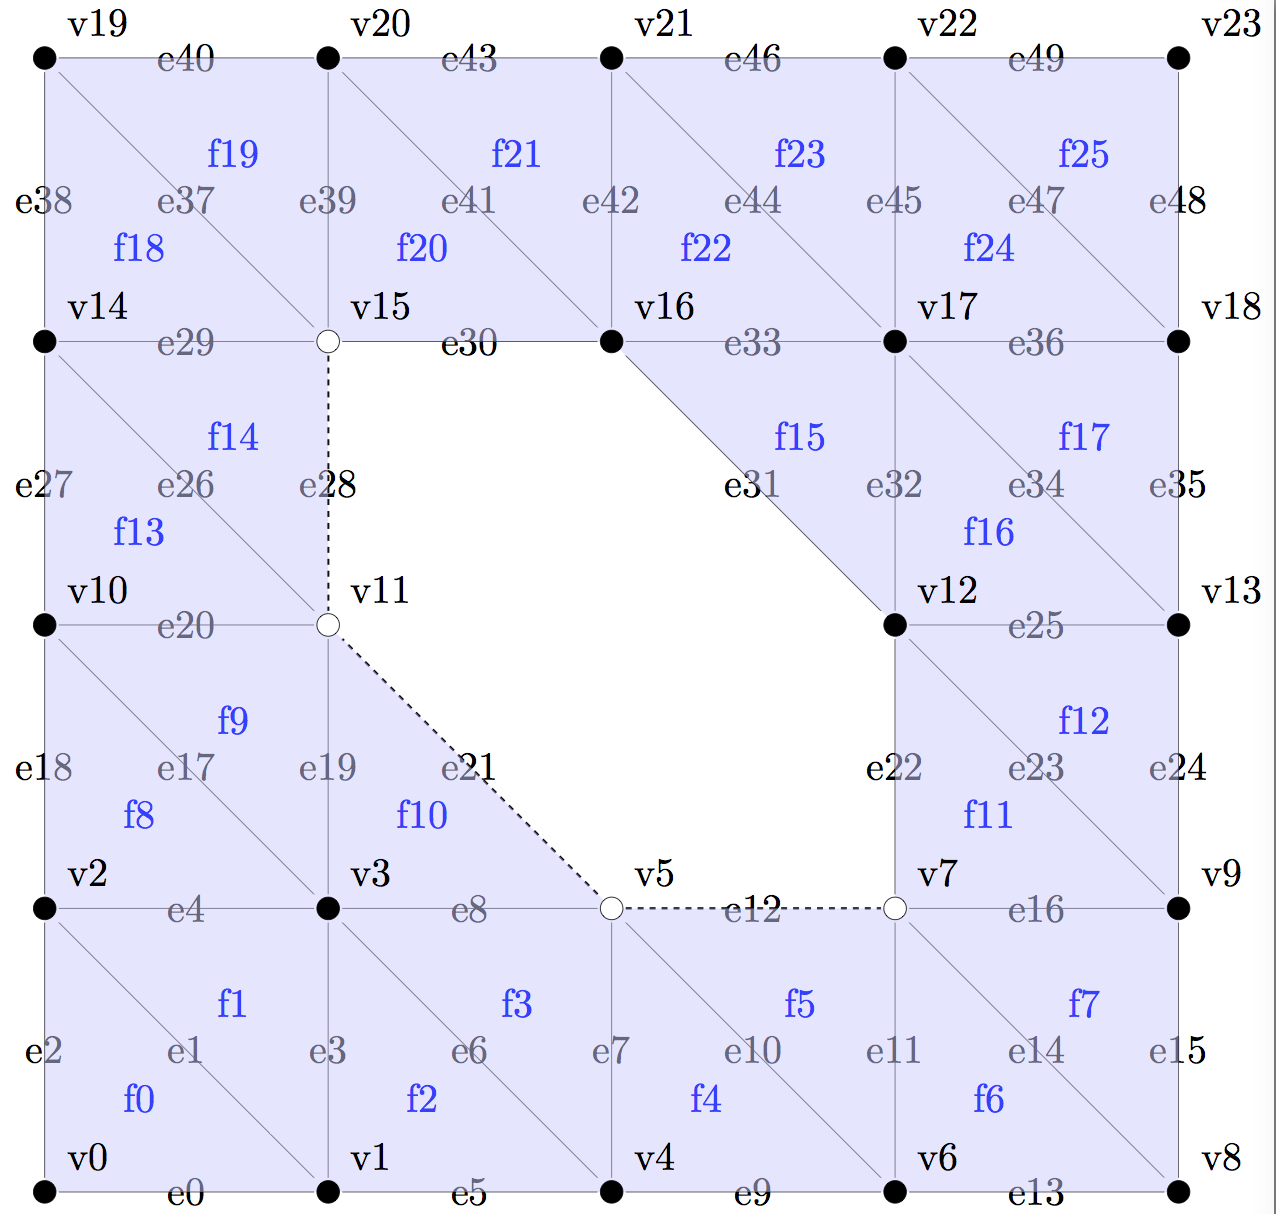
Draw
generates a PDF figure with indices of vertices, edges and faces.
It is arguably the most convenient way to visualize a small tiling.
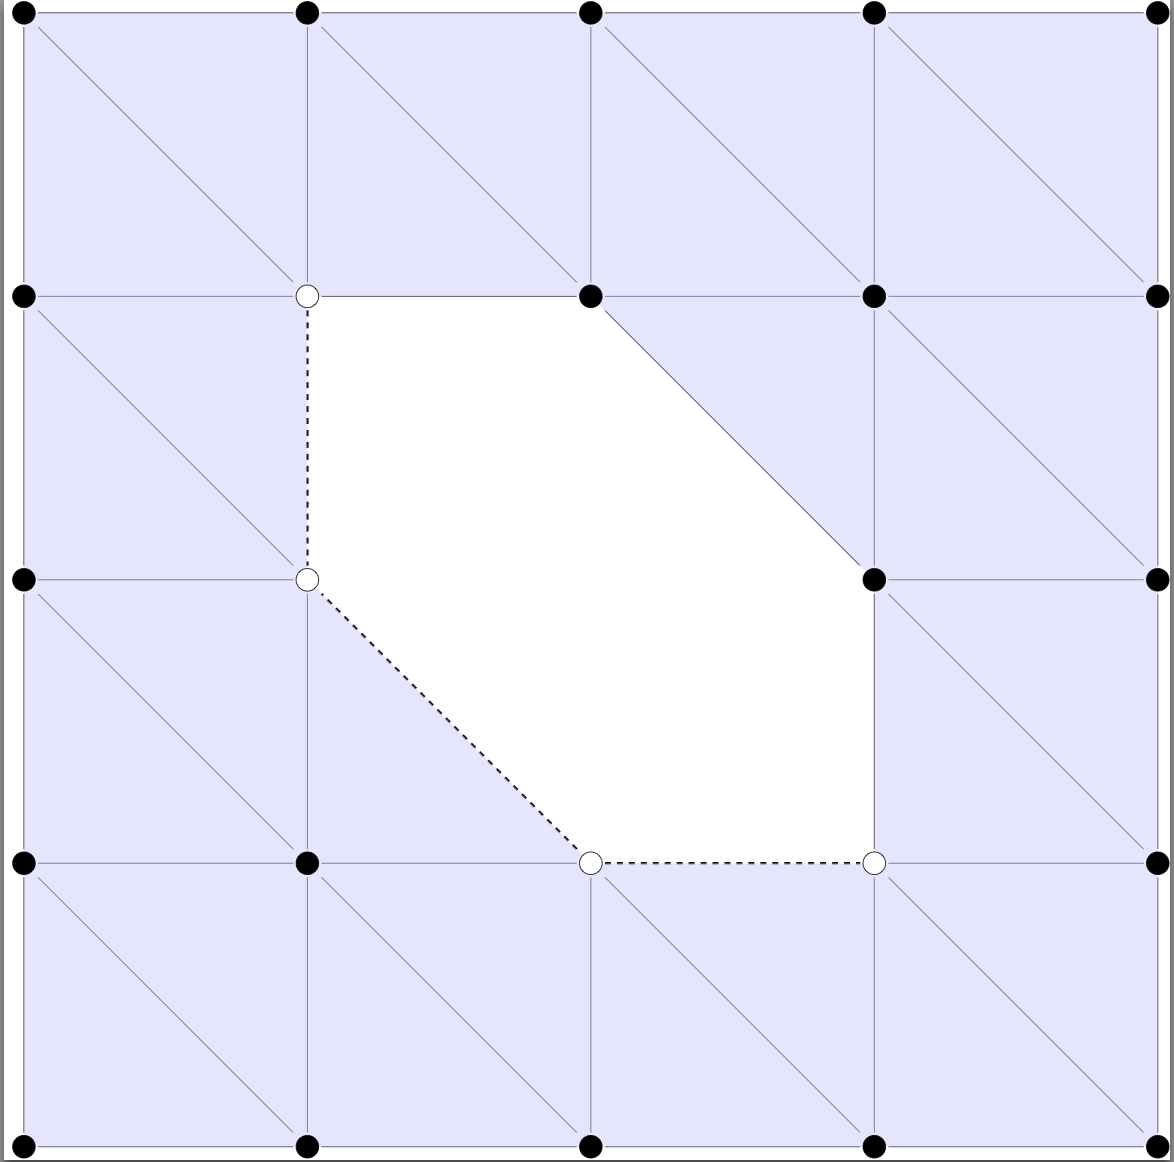
DrawMin
generates a pdf figure of the underlying graph without
any indices. This function is prefered for medium size tilings.
For large tiling though, only the next command should be used.
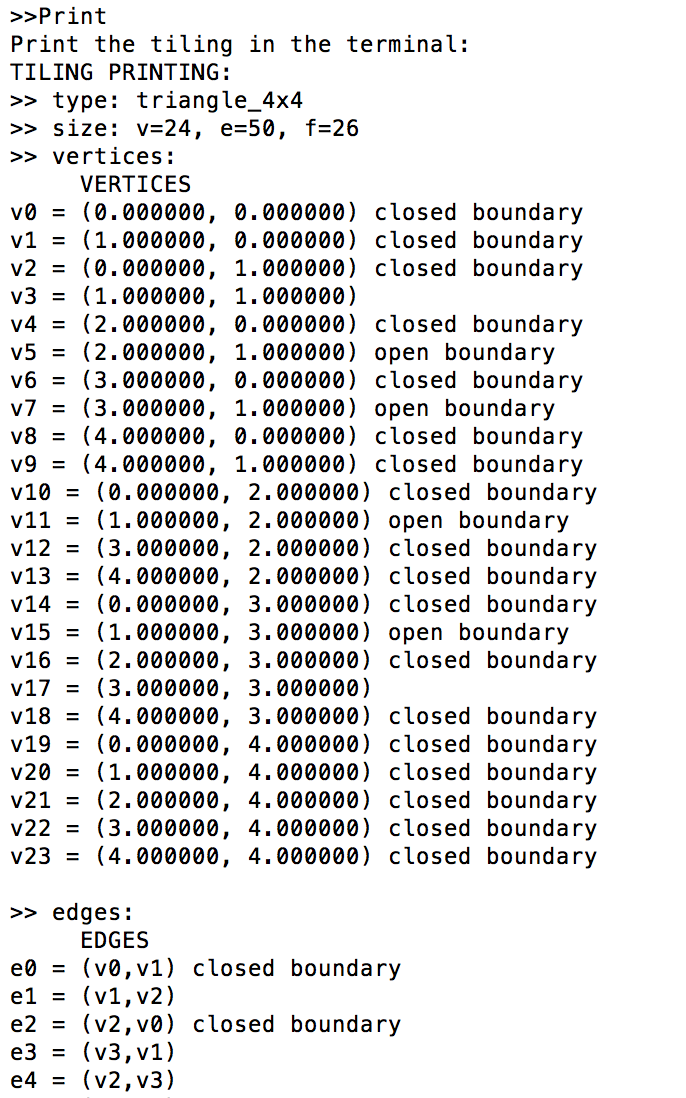
Print
displays the properties of the lattices in the terminal,
that is its name, its size, its vertices, its
edges and its faces and the incidence relations between them.
We use this function either when the coordinates are not defined,
making the drawing impossible, or when the tiling is to large to
be drawn.
Similar representations of the dual lattice can be obtained with
the functions
DrawDual
and
DrawDualMin
.
To illustrate these commands, we will print the same tiling and
its dual using
Draw,
DrawMin,
DrawDual,
DrawDualMin
and
Print.
Draw a tiling with indices
>>Tiling 6 4 4
>>HoleList 6 11 12 13 18 19 20
>>OpenList 3 28 21 12
>>Draw
Minimum drawing of the tiling
>>Tiling 6 4 4
>>HoleList 6 11 12 13 18 19 20
>>OpenList 3 28 21 12
>>DrawMin
Draw the dual tiling with indices
>>Tiling 6 4 4
>>HoleList 6 11 12 13 18 19 20
>>OpenList 3 28 21 12
>>DrawDual

Minimum drawing of the dual tiling
>>Tiling 6 4 4
>>HoleList 6 11 12 13 18 19 20
>>OpenList 3 28 21 12
>>DrawDualMin

Print the tiling in the terminal
>>Tiling 6 4 4
>>HoleList 6 11 12 13 18 19 20
>>OpenList 3 28 21 12
>>Print